Main Content

Making the most of the 2019 DBA Annual Survey Report
Your business’ copy of the DBA Annual Survey Report will have recently arrived, hot-off the press.

The benchmarking tool is highly valued by members; are you making full use of the information within?
Here the DBA’s Head of Services, Adam Fennelow discusses how to maximise the report to benefit your business.
What are some of the ways that DBA members use the report?
It’s invaluable in benchmarking salaries, fees and utilisation rates, but beyond those many members have also used the report to revamp the way their agency operates. They’ve leveraged the report to professionalise the running of the business, so that they understand the figures coming out of their own business and the context for those figures within the sector as a whole.
My favourite specific example of a member using the report was during negotiations with a client on hourly rates, which the client was claiming were too high. The head of the agency showed the client both the average and upper quartile hourly rates – “We benchmark against the upper quartile in the DBA report because we are better than average. If you want an average agency, there are thousands out there for you to choose from.” A clear example of premium positioning using the DBA report.
What are the key things you should use the report to track in your business?
The financial trinity of salaries, utilisation and recovery have a big part to play in how much you charge for your services and how much profit you make at the end of the day. They are all interlinked and using the information within the report will help you keep your business on track, or identify issues that are arising and could negatively impact your performance and profit margin.
Salaries: Total staff costs (including freelancer costs, plus staff benefits, pension contributions etc) should not exceed 60% of your income. The more strategic or specialised an agency becomes, the higher the salaries. As staff costs increase fees have to increase proportionally.
Utilisation: Obviously staff working on billable client work is a good thing (if it is profitable), but there are roles in an agency that have to spend time on non-client issues. Set realistic utilisation rates for staff and make sure you understand the reason for them.
Time sheets are the bane of creatives’ lives but they are needed to track profitability, otherwise how will you know when you have spent too much time working on a project and surpassed the time budgeted for? Every hour after this point digs into your profit margin.
Recovery: There are lots of reasons why the average recovery rate stands at 77% (click here for explanations on most of them), but the main ones are:
– under quoting (under estimating how long it will take to do the job)
– over servicing (constantly making tweaks and changes until the very last minute)
– scope creep (when the client keeps asking for just a little bit more).
A recovery rate of 77% means that you are only billing for less than four out of every five days you spend on client work.
Is there a simple gauge to check if a business is doing ok?
Apart from the obvious one (profit), income per head is a good indicator of how you are doing and whether action is required. It should be tracked on a monthly basis both in hindsight and as a target.
The figure is a percentage found from dividing your total income by your total number of fulltime staff (including freelancers and part time staff – eg someone working 3 days a week = 0.6 full time equivalent).
Agencies in London (with higher costs) should aim for over £100,000 per head. Agencies outside London should aim for over £80,000.
Are there any findings in the report that could have a greater impact in the coming years?
Yes. Overseas income has increased year on year for the last 5 years and is expected to grow. It currently stands at an average of 28% of total income. With the domestic market looking a bit stagnant, coupled with the low value of the pound and the great reputation of UK design, many agencies are looking further afield for work.
The Creative Industries Trade Investment Board (CITIB) recently launched a three-year strategy to grow the exports of creative industries by 50% by 2023. DBA CEO Deborah Dawton sits on the Board, and the DBA is supporting DBA members through our alignment and work with CITIB and the Department for International Trade to grow members’ reach internationally. You can read more about the strategy here and tap into a range of resources to help extend your international reach here (select ‘international trade’ category in DBA resources).
Watch footage from the launch event
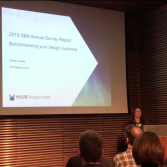
 The 2019 DBA Annual Survey Report sponsored by Paprika was launched at an event exclusively for DBA members, at which Esther Carder, Partner at Moore Kingston Smith and Adam Fennelow, Head of Services at the DBA shared insight into the report’s trends and findings. DBA members can login and watch footage from the 2019 DBA Annual Survey Report launch event here.
DBA members talk about how they use the DBA Annual Survey Report
Accessing the 2019 DBA Annual Survey Report
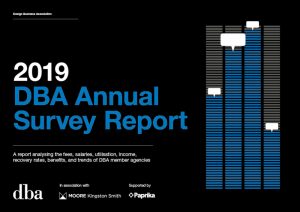
 The DBA Annual Survey Report is an invaluable members-only business tool which enables you to benchmark your financial performance with those of your peers.
Released each October it covers fees, salaries, utilisation, income, recovery rates, benefits and trends within DBA member companies. Data is segmented by geography and size of agency to make comparisons more relevant.
The 2019 report was recently launched. Find out how to access the report here.
Interested in gaining access to the report, but not yet a DBA member?
 DBA membership gives you exclusive access to a wealth of services and programmes that directly impact your team’s and your business’ performance. Browse the many benefits of membership here and/or contact Adam Fennelow today on adam@dba.org.uk or 020 7251 9229 to find out more about the value DBA membership will bring to your business.